雅思寫作小作文
雅思學術寫作小作文
線圖
雅思學術寫作小作文—線圖
雅思學術寫作小作文,亦即圖表寫作,具有非常固定的出題方式。此處推薦的雅思小作文寫作 5 步驟,可以用於規劃和撰寫一篇優秀的雅思學術寫作線圖小作文。
- 分析問題
- 確定圖表主要特點
- 撰寫導論 (introduction)
- 撰寫概論 (general overview)
- 撰寫細節段落
在練習寫雅思線圖小作文時,要勤於熟悉上述的規劃原則,大量反覆應用在考古題中,那麼在正式考試中必能得心應手。
許多考生不願意花時間在步驟 1 和 2,因為他們覺得時間寶貴,想把 20 分鐘都花在實際寫作上。但是,這樣做的結果往往是得不償失。
規劃過程的步驟 1 和步驟 2 需要大約 5 分鐘。至關重要的是,不要省這 5 分鐘而漏了做好規劃,因為優秀清晰的規畫是寫出高分文章的關鍵。
在本課中,我們將以線圖為題,示範整個規劃過程,同時實際完成文章寫作。
小作文 4 部分文章結構
對於所有雅思學術寫作小作文,幾乎都可以使用相同的基本結構。理想情況下,小作文應該有 4 段:
- 第一段:導論 (introduction)
- 第二段:概論 (general overview)
- 第三段:主要特點細節段落一
- 第四段:主要特點細節段落二
考生可以用這個架構作為所有雅思學術小作文的常規結構。最後提醒考生,官方規定小作文需要寫 150 個字。可以多一些,到大概 200 字上下。
過多的字數並不一定會得到考官的青睞而拿下更好的分數。畢竟字數太多,對於評分項目 Task Achievement 來說,好像代表了考生沒能掌握到寫作的要求。
當擁有了上述所需的概念與工具,就可以開始規劃和撰寫雅思線圖小作文了。
範例問題
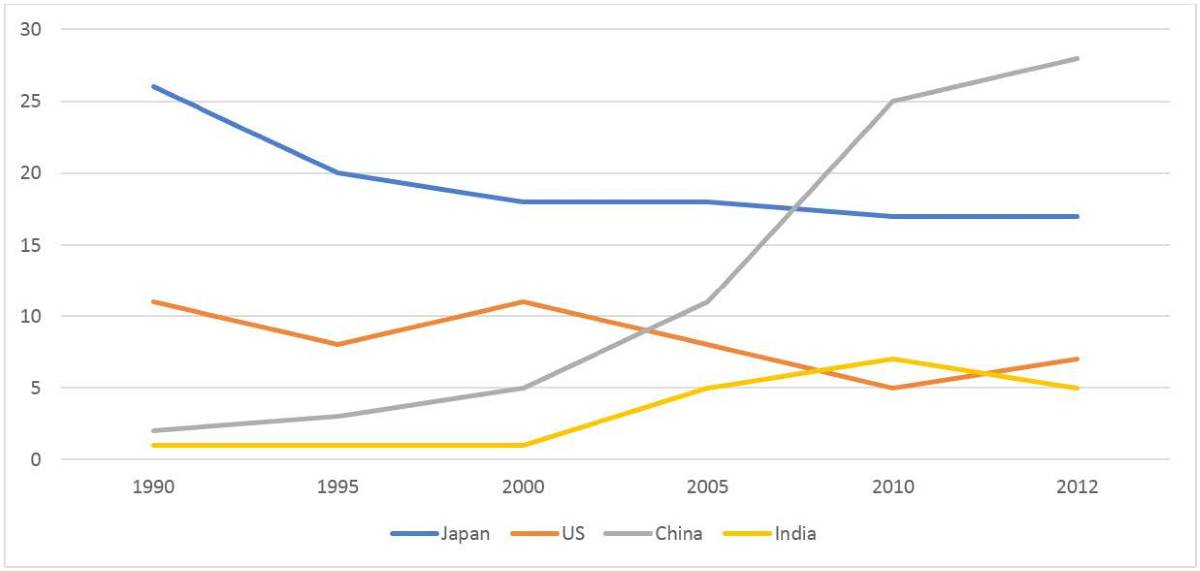
The graph below shows the percentage of Australian exports to 4 countries from 1990 to 2012.
Summarise the information by selecting and reporting the main features, and make comparisons where relevant.
Write at least 150 words.
第 1 步—分析問題
每個學術寫作小作文的格式均相同。以下特別標示的文字,是此處的示範問題中,與其他圖表題目中會同樣出現的文字。
The graph below shows the percentage of Australian exports to 4 countries from 1990 to 2012.
Summarise the information by selecting and reporting the main features, and make comparisons where relevant.
一般線圖問題包括:
- 圖形的簡要描述(第一句)
- 寫作指令(第二句)
- 圖形,表格,或其他圖表等
其中第 2 個句子告訴考生必須做什麼。考生必須做下列 3 件事:
- 選擇主要特點
- 撰寫主要特點
- 比較主要特點
所有三項任務都提到圖形的「主要特點 (main features)」。考生不必鉅細靡遺寫出所有的一切。只需挑選出 2 或 3 個關鍵特點,這樣就有非常多內容可以寫作。
本練習圖是一個動態線圖。也就是說,這個圖形包含一條時間線,提供來自於多個不同時間點的數據。
因此,對於這個問題,考生需要確定 1990 年至 2012 年澳洲出口至四個國家的占比及主要趨勢 (即總體發展或局部變化)。
至於靜態的線圖,也就是數據來自某一個時間點,沒有動態變化的,則比較少見。畢竟以直觀來說,線條本身就暗示了變動的意味,所以沒有時間變化的資料,會以柱狀圖、餅圖、或表格來表示,用線圖呈現的,自然就不多見。
第 2 步—確定圖形主要特點
雅思學術寫作小作文中的線圖問題有明顯的趨勢變化,所以一般而言不難解釋。
考生對圖形內容不必作複雜的計算。要記得,雅思寫作問題要測驗的是考生的資料歸納整理和語言能力,而不是數學能力。
思考流程與重點
在小作文寫作中,考生需要找的是主要特點。這些通常是最容易發現的部分。
圖形中會有很多資訊來提醒考生如何識別這些特點。此時考生需要思考下面這些有用的問題。
- 圖形中兩軸提供什麼資訊?
- 是動態的還是靜態的?
- 測量單位是什麼?
- 從標題和標籤中能看到什麼?
- 時間區段是什麼?
- 最明顯的趨勢是什麼?
- 最明顯的相似或相異之處是什麼?
本題主要特點
那麼,在本文提供的練習圖形中,有哪些主要特可以點讓考生選擇來撰寫呢?
以下是本課所探討的雅思線圖:
時間軸可以為考生提供重要趨勢的核心資訊,從其中可以觀察出總體趨勢。
此線圖有 2 項主要特點/趨勢:
- 主要特點 1:澳洲出口到中國與印度的占比呈現增加趨勢,但是輸出到美國與日本的產品比例則下滑。
- 主要特點 2:中國進口澳洲產品成長快速,其占澳洲出口比例從極低數值躍升為首位。
小作文在時間分配上,最好控制在 20 分鐘之內,同時由於要求只要 150 字即可,所以無法包含過多的詳細資訊。
現在要準備開始撰寫論文。以下是即將要使用的 4 部分結構的提示。
- 第一段:導論 (introduction)
- 第二段:概論 (general overview)
- 第三段:主要特點細節段落一
- 第四段:主要特點細節段落二
第 3 步—撰寫導論
在導論中,考生應該簡單地解釋這個問題,亦即用不同的方式說同一件事。考生可以透過使用同義詞和更改句子結構來做到這一點。例如:
The graph below shows the percentage of Australian exports to 4 countries from 1990 to 2012.
Introduction (Paragraph 1):
The given line graph illustrates the proportions of Australian products exported to four countries—namely, Japan, US, China, and India—between 1990 and 2012.
這就是導論部分所需要做的介紹。
理想情況下,關鍵詞如 shows和 percentage 應該被同義詞所取代,但是如果沒有任何明顯的詞可以代替的話,也可以重複使用。另外,適當地增加原題目沒有的重要資訊,像是本例中的國家名稱,也是讓導論與原題目產生差異變化的有效方式。
改寫過程中重要的是,所使用的語言聽起來自然,因此絕對不要試圖勉強使用不適合的同義詞。
第 4 步—撰寫概論 (第二段)
在第二段中,考生應該整理出在圖表中可以看到的一般趨勢主要特點,只提供常規資訊,而不必寫出詳細內容以及數字。如果有相關內容的話,在此處還應進行明確的比較。
第二段是撰寫一般趨勢的地方。以下是從題目的圖形中所挑選出來的一般趨勢特點。
- 主要特點 1:澳洲出口到中國與印度的占比呈現增加趨勢,但是輸出到美國與日本的產品比例則下滑。
- 主要特點 2:中國進口澳洲產品成長快速,其占澳洲出口比例從極低數值躍升為首位。
現在把這些想法形成兩三個句子,字數總共大約 40 個字。盡可能使用同義詞說明資訊。不需要複雜的詞彙或語法結構,只需要適當的單詞和正確的動詞時態。
例如:
Overview (Paragraph 2):
In general, while Australian exports to China and India increased over the period, the US and Japan saw a decline in products imported from Australia. In addition, China experienced the biggest increase in exports over the period, making it the biggest export market of Australia from around 2007 onwards.
第 5 步—撰寫主要特點細節段落一
雅思線圖文章的第 3 和第 4 段是有關圖形中數據的更多詳細資訊。在第 3 段中,考生應該提供證據來支持第二段中所提出來的前 1 或 2 項關鍵特點。當內容相關時,不要忘記進行比較。
以下是挑選出來的第 1 項主要特點:
- 主要特點 1:澳洲出口到中國與印度的占比呈現增加趨勢,但是輸出到美國與日本的產品比例則下滑。
以下例子是可以撰寫的內容:
Paragraph 3:
In 1990, Japan was the leading export market of Australia, receiving over 25% of all exported goods. US was the second importer of Australian goods that year, with a proportion of over 10%. Conversely, China and India barely imported merchandise for Australia, with way below 5% each. Over the next twenty years, the commodity exported to China and India grew nearly every year while that to Japan and US showed a general decline.
第 6 步—撰寫主要特點細節段落二
對於第四段,也通常是最後一段,考生應該對剩餘的主要特點進行相同的步驟。針對例示題目,還有第 2 項主要特點要寫。
- 主要特點 2:中國進口澳洲產品成長快速,其占澳洲出口比例從極低數值躍升為首位。
以下是可以撰寫的內容範例:
Paragraph 4:
In 1990, China received only a mere 2% of Australian goods; by 2012, the percentage of exports to China had seen a dramatic rise to almost 30%, making China the leading business partner of Australia. Meanwhile, Australia exported just over 10% of its goods to the US in 1990, which was around ten times higher than the exports to India. Over the following two decades, the figures for the US fluctuated, and dropped to 7% in 2012. The percentage of exports to India, on the other hand, remained unchanged until 2000, and then increased to about 7% in 2010, before dropping slightly to roughly 5% in 2012.
完成的線圖小作文
下面是四個段落彙集在一起,結合完成的最後文章。
The given line graph illustrates the proportions of Australian products exported to four countries—namely, Japan, US, China, and India—between 1990 and 2012.
In general, while Australian exports to China and India increased over the period, the US and Japan saw a decline in products imported from Australia. In addition, China experienced the biggest increase in exports over the period, making it the biggest export market of Australia from around 2007 onwards.
In 1990, Japan was the leading export market of Australia, receiving over 25% of all exported goods. US was the second importer of Australian goods that year, with a proportion of over 10%. Conversely, China and India barely imported merchandise for Australia, with way below 5% each. Over the next twenty years, the commodity exported to China and India grew nearly every year while that to Japan and US showed a general decline.
In 1990, China received only a mere 2% of Australian goods; by 2012, the percentage of exports to China had seen a dramatic rise to almost 30%, making China the leading business partner of Australia. Meanwhile, Australia exported just over 10% of its goods to the US in 1990, which was around ten times higher than the exports to India. Over the following two decades, the figures for the US fluctuated, and dropped to 7% in 2012. The percentage of exports to India, on the other hand, remained unchanged until 2000, and then increased to about 7% in 2010, before dropping slightly to roughly 5% in 2012. (253 words)
線圖小作文結語
這篇範例文章已超過最少字數限制,因此可以看出,為何沒有空間或時間來容納非常詳細的內容。這也就是為什麼必須選擇幾個主要特點來撰寫小作文的原因。
接下來,考生可以使用在本文所學到的方法與技巧來練習回答其他雅思線圖問題。
記得最重要的是要作好規劃,找到主要特點。其後的寫作都有許多的參考句型與用字可供選擇,但是整理重點的技巧只能靠平常訓練,無法在考前臨時抱佛腳。
剛開始練習可能速度很慢,但是只要掌握到訣竅,繼續練習,相信在大概 10 篇文章之後,就能具備能夠在 20 分鐘左右規畫並完成撰寫一篇完整小作文的功力。
本課到這裡已經為準備雅思考試的考生,整理了如下的小作文重要內容。如果對於任何一個主題還有不清楚之處,請點選下列連結複習,然後再繼續往下進行。
目 錄